Harmony Public Schools' anomalous increase
in percent at-risk students for 2010-11
Page created Sep 16, 2012
Charter schools are often not evaluated based on performance alone. Instead, they may be compared to other schools with "similar" student demographics or characteristics. This creates a powerful incentive for these schools to report the maximum number of minority, low-income, LEP, or at-risk students, as all such sub-populations are considered harder to educate.
Harmony Public Schools, a large chain of Gulen charter schools in Texas, has been applauded for its performance based on the number of "at-risk" students, that is, students considered at risk of dropping out. On August 18, 2012, the Austin American-Statesman ran an article entitled "Can charter schools learn a lesson from charters' efficiency?" The article stated "Harmony's schools have also consistently beat the rest of the state on standardized test scores even while educating about the same proportion of students considered at risk of dropping out."
The Texas Education Agency publishes annual "AEIS" reports (school report cards) for each public school in Texas. These reports are accessible from their website. For each school, a count of "at-risk" students is given. Presumably, this should be the most objective way to assess whether Harmony does indeed have a similar proportion of at-risk students to other schools in the state.
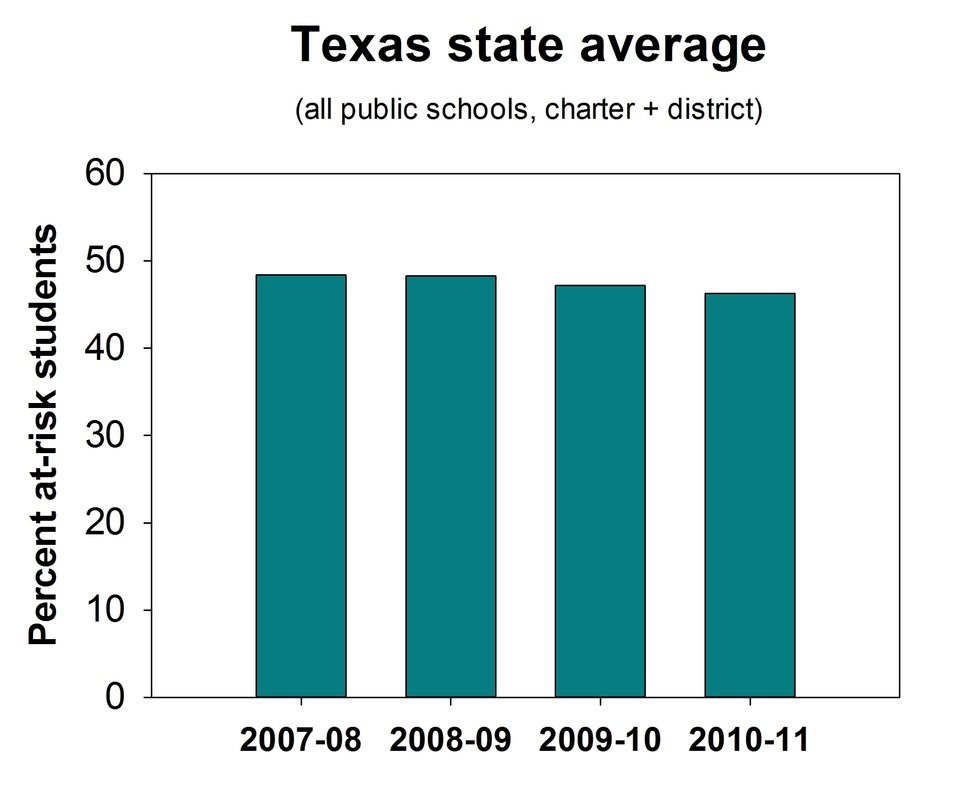
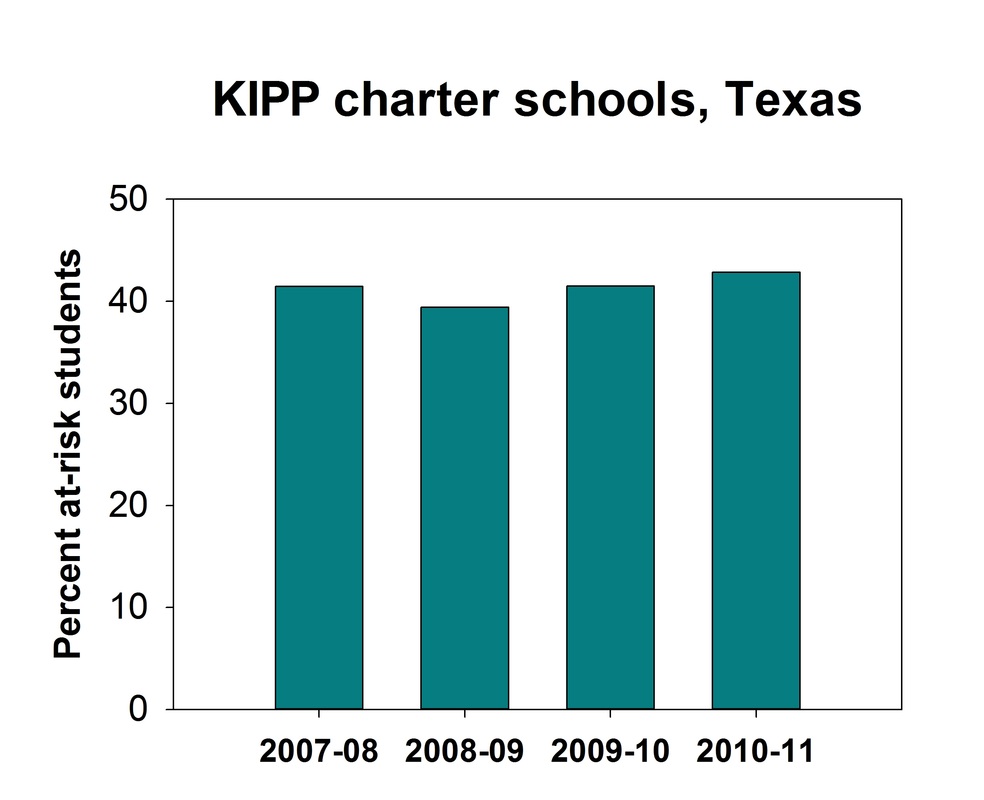
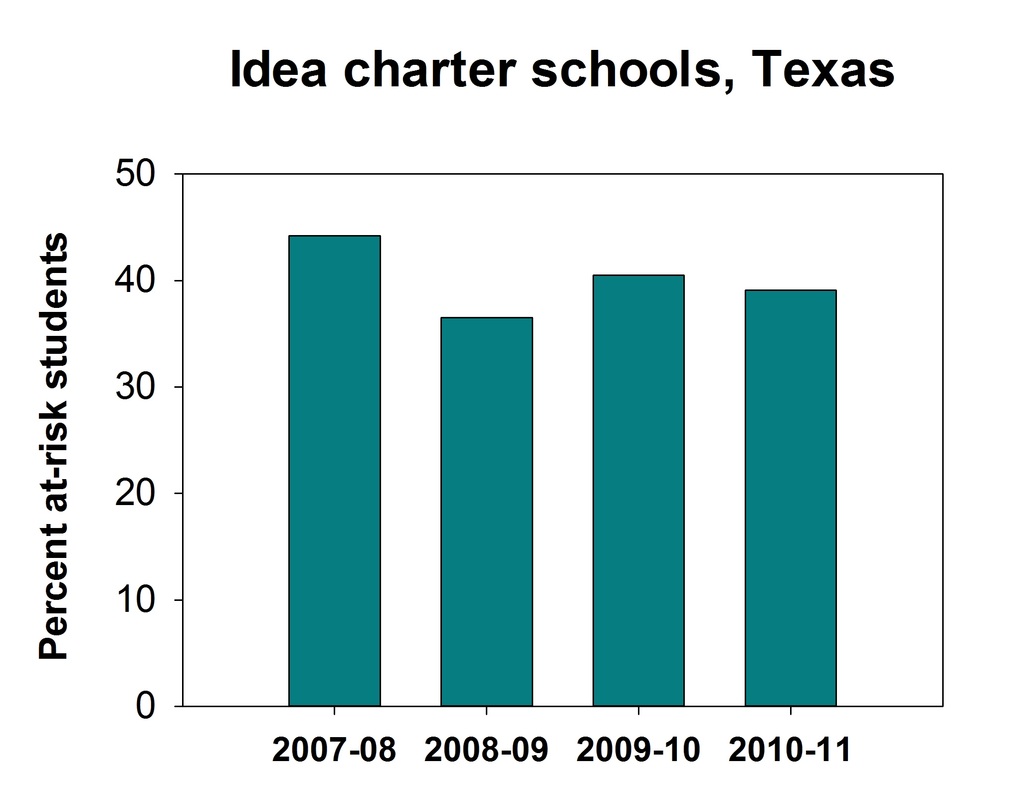
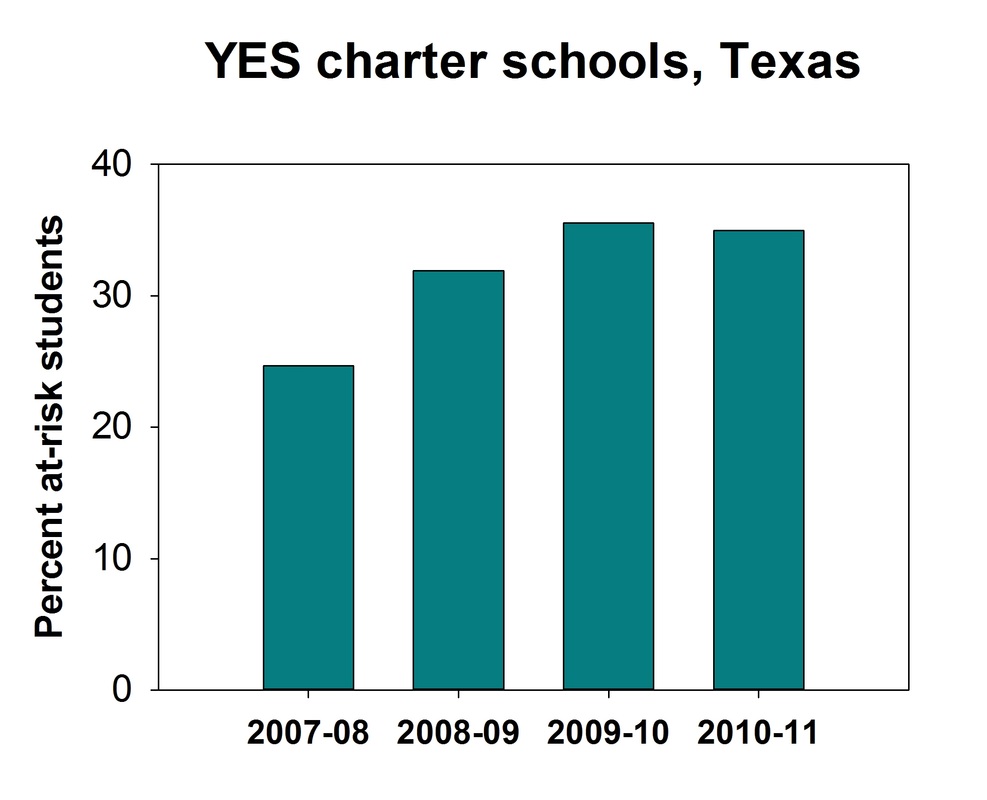
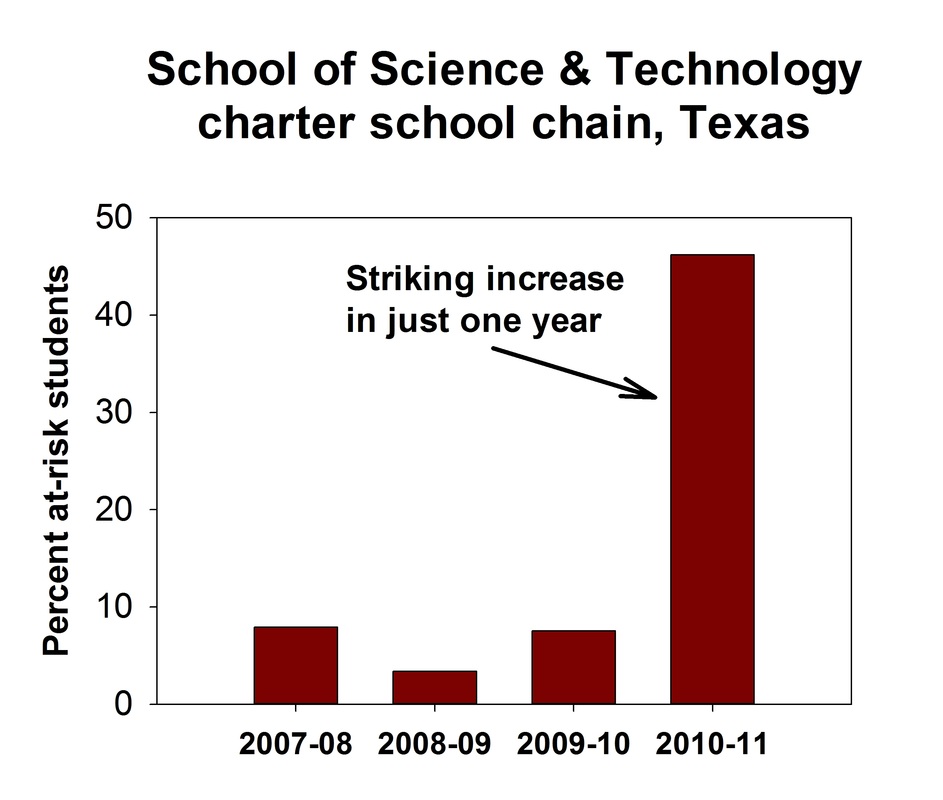
The following graphs show that Harmony Public Schools actually had a substantially lower-than-average percentage of at-risk students, compared to the Texas average as well as other large charter chains such as KIPP, Idea and YES, up until the 2010-11 school year. In that school year, both Harmony and the School of Science and Technology chain (a smaller chain of Gulen charter schools based in San Antonio) showed a striking increase in percent of at-risk students as reported on the AEIS. No similar increase can be seen for either the Texas state average, or the KIPP, Yes and Idea charter school chains, all of which show fairly level trends over the years. (The percentages shown below for the charter chains are for their entire student population, summed across all their schools.)
Charter schools are often not evaluated based on performance alone. Instead, they may be compared to other schools with "similar" student demographics or characteristics. This creates a powerful incentive for these schools to report the maximum number of minority, low-income, LEP, or at-risk students, as all such sub-populations are considered harder to educate.
Harmony Public Schools, a large chain of Gulen charter schools in Texas, has been applauded for its performance based on the number of "at-risk" students, that is, students considered at risk of dropping out. On August 18, 2012, the Austin American-Statesman ran an article entitled "Can charter schools learn a lesson from charters' efficiency?" The article stated "Harmony's schools have also consistently beat the rest of the state on standardized test scores even while educating about the same proportion of students considered at risk of dropping out."
The Texas Education Agency publishes annual "AEIS" reports (school report cards) for each public school in Texas. These reports are accessible from their website. For each school, a count of "at-risk" students is given. Presumably, this should be the most objective way to assess whether Harmony does indeed have a similar proportion of at-risk students to other schools in the state.
The following graphs show that Harmony Public Schools actually had a substantially lower-than-average percentage of at-risk students, compared to the Texas average as well as other large charter chains such as KIPP, Idea and YES, up until the 2010-11 school year. In that school year, both Harmony and the School of Science and Technology chain (a smaller chain of Gulen charter schools based in San Antonio) showed a striking increase in percent of at-risk students as reported on the AEIS. No similar increase can be seen for either the Texas state average, or the KIPP, Yes and Idea charter school chains, all of which show fairly level trends over the years. (The percentages shown below for the charter chains are for their entire student population, summed across all their schools.)
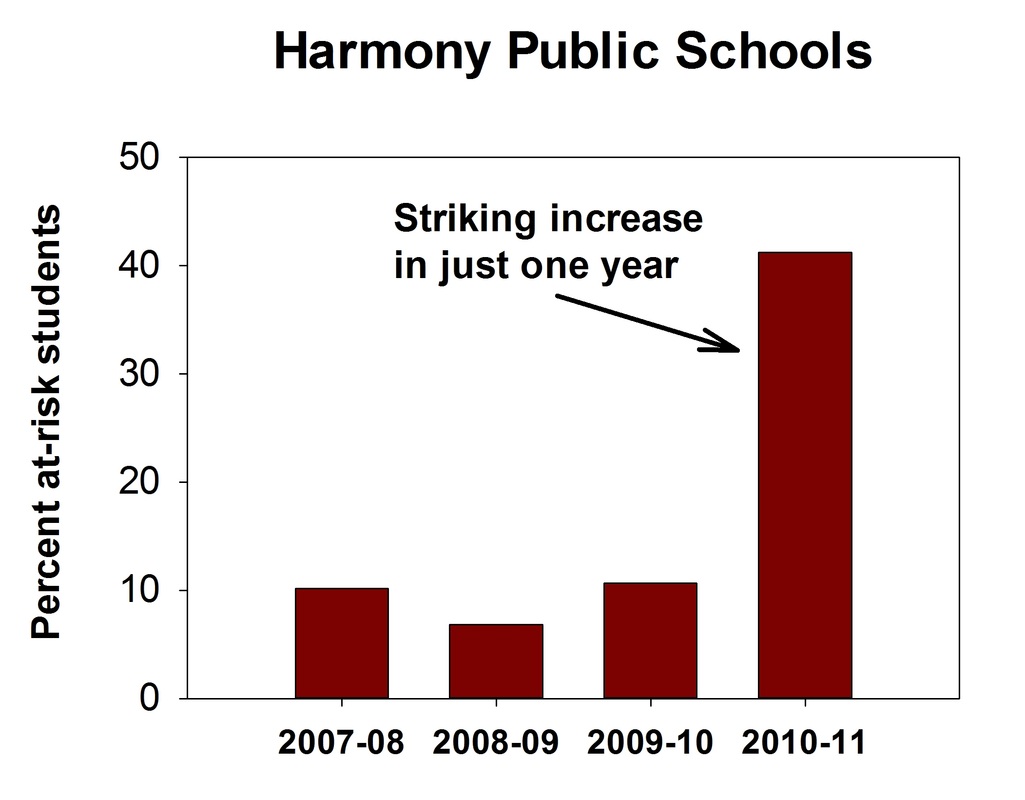
What could possibly account for such a dramatic rise in the number of at-risk students in these two chains of Gulen charter schools? There is no evidence that they changed their recruiting methods significantly, or that they suddenly moved their schools to geographical areas with higher percentages of at-risk students. Even more puzzling is the fact that these schools still have a fairly low percentage of LEP (limited English proficiency) students. All LEP students are automatically counted as "at-risk," so most schools derive a sizable proportion of their at-risk students from their LEP count. But Harmony did not experience a large increase in LEP students in 2010-11.
One concerning point is that the count of at-risk students is likely self-reported by schools and districts. The state of Texas education code specifies the criteria for classifying students as at-risk (see the AEIS glossary for the complete list); these include LEP status, a history of repeating grades, poor academic performance, a history of problems with the law or disciplinary referrals, parenthood or pregnancy, etc. Harmony AEIS reports show an extremely low if not zero count for number of students with disciplinary referrals, so that is unlikely to account for a large number of at-risk students. One of the points on the list is potentially rather subjective and could be adjusted by a school or district: "is in grades 7, 8, 9, 10, 11, or 12 and did not maintain an average equivalent to 70 on a scale of 100 in two or more subjects in the foundation curriculum during a semester in the preceding or current school year or is not maintaining such an average in two or more subjects in the foundation curriculum in the current semester." A school or district could potentially adjust its grading scale so that more students had a lower-than-70 average, even though they might still be performing well on the TAKS (standardized tests).
Even more concerning is the fact that each Texas district can legally set its own criteria for defining at-risk students. This is evident from a document available on the Texas Education Agency's website entitled "State Compensatory Education: Frequently Asked Questions - School Year 2011-2012." This document states: "Are school districts allowed to use local criteria for identifying at risk students? Yes. In addition to serving students who meet the state at risk criteria, school districts may serve (§29.081, TEC) students who meet local eligibility criteria if the local criteria have been adopted by the board of trustees of a school district." While there are restrictions on the amount of supplemental funds districts can receive for additional "at-risk" students identified by their own criteria, there does not appear to be any limit to the number of students the district can put in the at-risk category. Note that all Harmony schools operate in districts controlled entirely by Harmony Public Schools; none of them operate under a traditional school district. Thus, legally, Harmony Public Schools can set its own standards for defining "at-risk."
This raises an extremely important point omitted by the Austin American-Statesman in their August 18, 2012 article: schools and chains of schools are being compared with each other based on criteria that are not consistently defined across school districts. If Harmony's definition of "at-risk" student is completely different from that of most other Texas school districts, then it is meaningless to say that Harmony's performance is impressive because it is "educating about the same proportion of students considered at risk of dropping out."
Comparisons of schools, districts and school chains are only meaningful when the same standards are used for all measures that are to be compared. It is sincerely hoped that the news media will start to pay closer attention to this point before making assertions about school performance.